Trending & Visualization

  • Real-time trending, historical trending, and HMI / mimic graphics

  • Blazing-fast loading speed. Hundreds of entries loaded in seconds

  • Multiple axes and scales allowing many data sets to be plotted on the same graph

  • Zooming in the X and Y dimensions allows the examination of data points closely and precisely

  • Tool-tip labels can be used to plot comments on the chart with overlaying data

  • Custom colors can be used to mark and highlight events

  • Charts can be easily exported and printed as PNG, JPG, PDF, or SVG

  • Data-grids allow easy navigate and viewing of real-time data
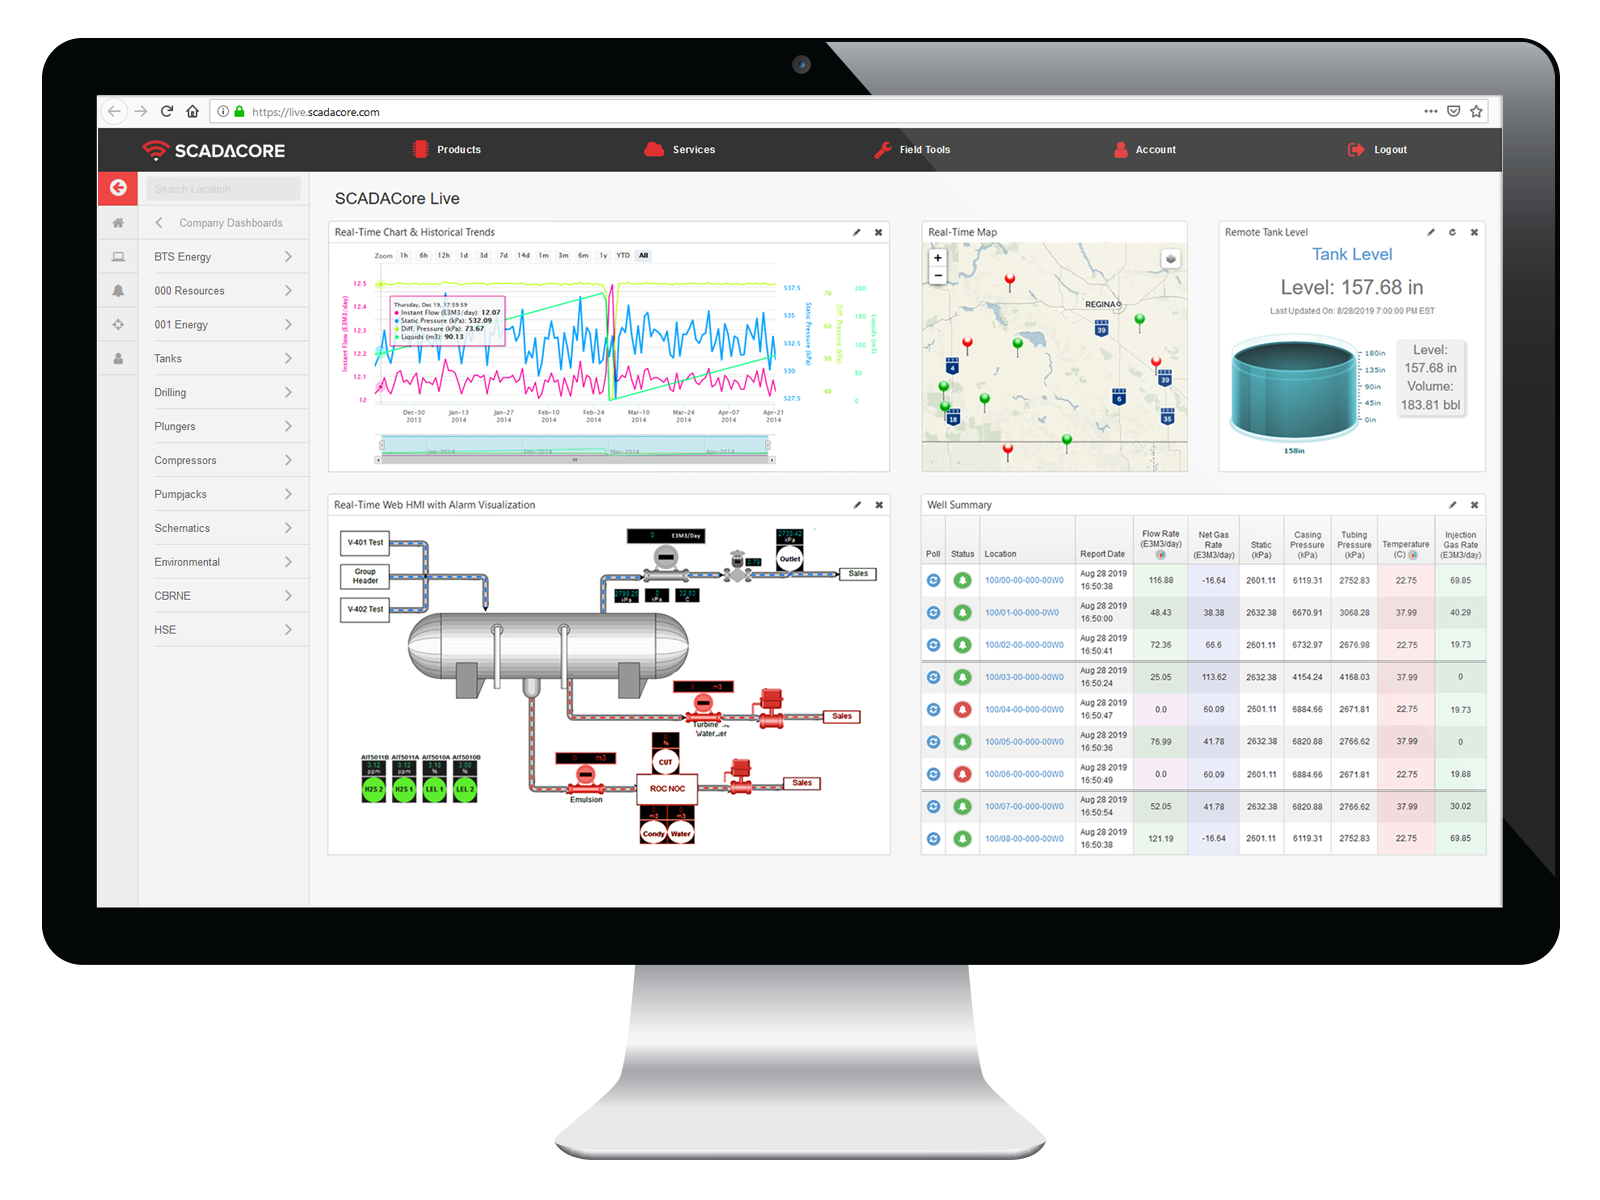
SCADACore Live is the most powerful Web SCADA / IIoT systems worldwide. The system collects remote field data and plots the data points onto our advanced charting system to show secondly reports, hourly reports, daily reports, and more. Our HMI designer and HMI display are accessible through any web browser or our mobile app.

Contact Us

SCADACore Live’s Chart Example

Remote Monitoring Chart Screen

Real-Time Data Report

Real Time Report Screen
Contact Us

SCADACore Live Visualization: HMI Designer and HMI Display

Web SCADA / IoT HMI / Mimic Graphics
More About Our HMI